
Hospitality marketing can turn travel research into a useful booking test. Choose a property, travel dates and a guest question, improve the page that answers it, then measure qualified inquiries or bookings against the inventory you can actually sell.
National travel research can help you choose a question. Your availability, guest conversations and booking records decide whether that question matters locally. Here is a practical way for a marketing lead and property operator to turn those inputs into one focused test.
Choose the stay and the obstacle
Ask the property team where a clearer explanation would help: an underused travel period, a lodging type guests misunderstand or a recurring question about the experience. Confirm that the stay is available and operations can deliver what the page promises.
Review recent booking questions and cancellations without copying personal guest information into public content. Identify one obstacle, such as unclear pet rules, seasonal amenities, accommodation differences or the route from the page to available dates.
Write a one-sentence brief: help this guest understand this stay for these dates and take this next step. Name the property contact who will verify details and the marketing owner who will run the test.
Make the property page answer that question
Show the actual accommodation, verified amenities, operating dates and practical restrictions. Use real permitted photography. Explain how to check current availability and total price. Test the booking link on a phone and confirm it reaches the intended property. Keep the same promise in the ad, page and booking journey.
What the evidence says
Does outdoor recreation GDP measure travel demand?
BEA’s March 5, 2026 release reported that outdoor recreation contributed $696.7 billion in current-dollar value added, or 2.4% of U.S. GDP, in 2024. Inflation-adjusted outdoor recreation GDP rose 2.7%. These are 2024 results released March 5, 2026, not 2026 travel sales. The release revised earlier years. BEA now marks that release as superseded; these figures are a dated example of how to interpret value added, not a current market estimate. [1]
The accounting scope includes goods, services and supporting activities. BEA assigns activity by place of production, not the consumer’s home. A state’s outdoor economy is therefore not a map of where to find prospective guests. [2]
What do National Park visit counts actually measure?
NPS reported 323,014,305 recreation visits across 406 reporting parks in 2025. This is a National Park System total, not a count for all outdoor destinations. [3] A person returning on another day can create another visit. NPS overnight stays count person-nights, not room-nights or campsite reservations. Park-specific counting methods can include counters and estimation. [4]
Use the relevant park and comparable months when studying a local question. Check counting changes before interpreting a shift as a change in traveler preference.
Survey findings need their boundaries
KOA’s April 14, 2026 release reports that more than 52 million North American households camped in 2025. It describes 4,088 online household surveys: 2,834 U.S. and 1,254 Canadian. Recruitment was not limited to KOA camper databases, and the incidence sample was balanced for selected demographic characteristics. [5]
This is commissioned survey research, not a census of bookings. It can suggest questions about motivations and trip types. It does not establish demand for a particular operator, prove a health benefit or show that stated plans became completed trips.
Put the evidence to work
A review before a claim becomes copy
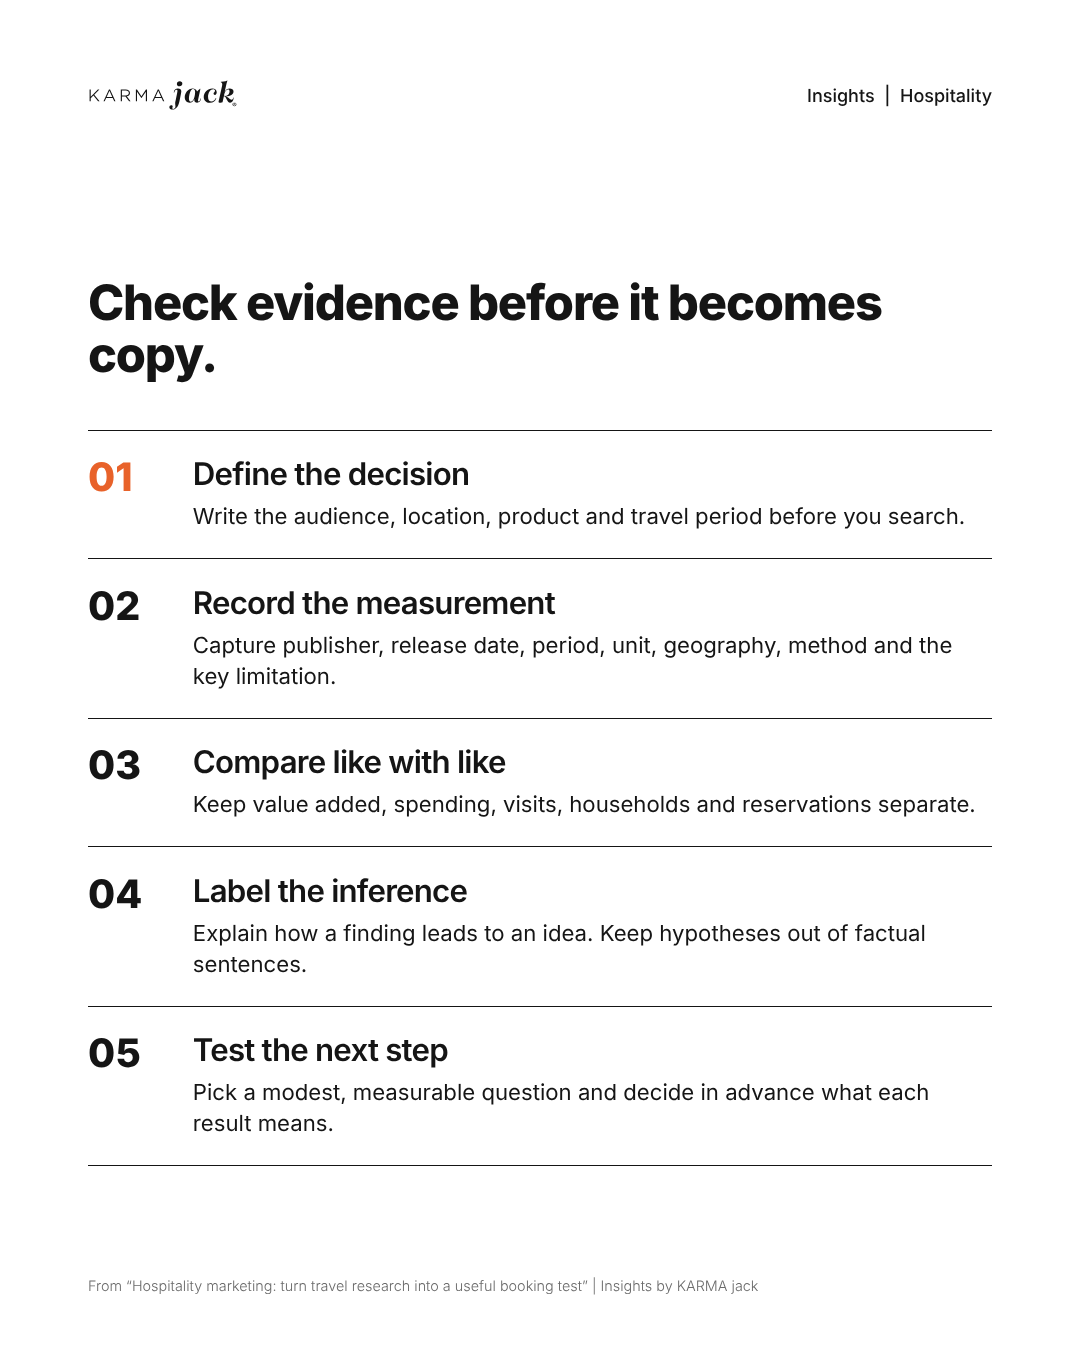
- Define the decision. Write the audience, location, product and travel period before searching. A national annual result may be useful context even when it cannot answer the local question.
- Record the measurement. Capture the publisher, release date, observation period, unit, geography, sample or counting method, and the limitation that matters to the claim.
- Compare like with like. Keep value added, spending, visits, households and reservations separate. Compare the same months and use one release version when the publisher revises prior years.
- Label the inference. Explain how a finding leads to an idea. Keep forecasts and creative hypotheses out of the factual sentence unless the source actually supports them.
- Test the next step. Choose a modest, measurable question. Decide in advance which result would support, weaken or leave the idea unresolved. Do not promise a lift.
A hypothetical example
A survey suggests that some campers value a simpler outdoor experience. A responsible next step is to ask whether a clear description of an actual quiet setting helps a defined audience understand the stay. That is a messaging hypothesis, not proof that amenities are unnecessary or that nature will treat a health condition.
Before using the message, verify the actual experience and the dates it is available. Write a short test brief:
- Audience, property, travel dates and the customer question.
- Current message and the single change being tested.
- Primary outcome, such as completed stays or qualified booking inquiries, with its denominator and follow-up window.
- Comparison period or group, budget, owner and review date.
- Cancellations, unavailable dates, price changes and other factors that could explain the result.
Decide in advance what would support, weaken or leave the idea unresolved. Keep an inconclusive result when the evidence is insufficient.
Keep the caveat beside the claim
A short source label is more useful than a distant disclaimer. For example: “BEA estimates U.S. outdoor recreation value added for 2024.” Avoid rewriting that finding as “Outdoor lodging demand is growing in our market.” The latter needs different evidence.
Connect the test to a useful business decision
At the review, compare completed bookings or qualified inquiries for the defined travel period, and follow cancellations through the same window. Record available inventory, rates, media spend and changes to the offer. A higher click rate with no useful booking activity is a reason to inspect the next step before increasing spend.
KARMA jack‘s hospitality work brings together content, paid campaigns, search and website strategy. A practical starting point is one verified property story, a working booking path and a test brief that the property and marketing teams can both use. Bring those inputs to the next planning conversation.
Hospitality marketing test questions
How do we choose the first hospitality marketing test?
Choose a real property, available travel dates and a recurring guest question. Confirm operations can deliver the promise, then improve the page and booking route around that one question.
Which details should stay with a travel-research claim?
Keep the publisher, release date, observation period, unit, geography and method with the claim, plus the limitation that affects its use. National economic, visit and household measures answer different questions.
What should a booking test measure beyond clicks?
Follow qualified inquiries or completed bookings for the defined travel period, including cancellations. Record inventory, rates, media spend and offer changes so a result is not attributed to the page alone.
Sources and interpretation notes
Source review: October 27, 2026; BEA release/data page, NPS visitation release and KOA release rechecked November 12, 2026. References below identify what each source supports. Editorial guidance in this paper is a proposed working method, not a result measured by those publishers.
[1] BEA 2024 outdoor recreation release
Released March 5, 2026. U.S., 50 states and D.C.; economic-account estimates for 2024 with revisions to 2020 through 2023. Supports the value-added and real-growth figures. Do not relabel current-dollar GDP as sales or booking value.
[2] BEA additional information
Updated March 5, 2026. Defines value added, gross output, prices and geographic allocation. Supports the production-location distinction. Economic scope differs from a household survey and from park attendance.
[3] NPS 2025 visitation release
Released March 13, 2026. Reports calendar-year 2025 recreation visits for 406 National Park System units. Supports the system total. It does not cover every public land, campground or lodging business.
[4] NPS visitor use statistics FAQ
Updated March 26, 2026. Defines visits and overnight stays and explains park-specific counting. Monthly figures are preliminary before annual finalization. Inspect local methods and revisions before making comparisons.
Released April 14, 2026. U.S. and Canadian household survey reporting on 2025 behavior and 2026 intentions. The release reports full-country margins of error, not precision for every subgroup. This paper does not reproduce subgroup estimates or independently reanalyze the survey.
When to refresh
Recheck the source before a new planning cycle. At our November 12 check, BEA’s data page still listed November 18, 2026 as the next release, while the March release carried a superseded notice. Verify the currently released tables before using any figure in a forecast or campaign. [6] Replace outdated figures with comparable newer evidence; do not quietly mix reporting periods. No source here establishes a guaranteed business outcome.
