HVAC market demand is best assessed with local search, weather, capacity and sales evidence. Before increasing spend, choose a service your team can deliver, the area it serves and one customer-journey problem to test.
Start with the service you can support
Ask the owner or operations lead to confirm appointment capacity for repair, replacement or maintenance in the real service area. Have the marketing lead pull inquiries and search activity for the same service and period. Have sales identify where appropriate prospects stop: before contact, before the estimate or after receiving it.
Match the action to the gap. Weak relevant inquiries call for a check of search intent, service-page clarity and targeting. Inquiries that do not become appointments call for an intake and availability review. Estimates that do not become sales call for a review of explanations, follow-up and customer feedback. These are diagnostic paths, not proof of the cause.
Do HVAC shipment numbers show local demand?
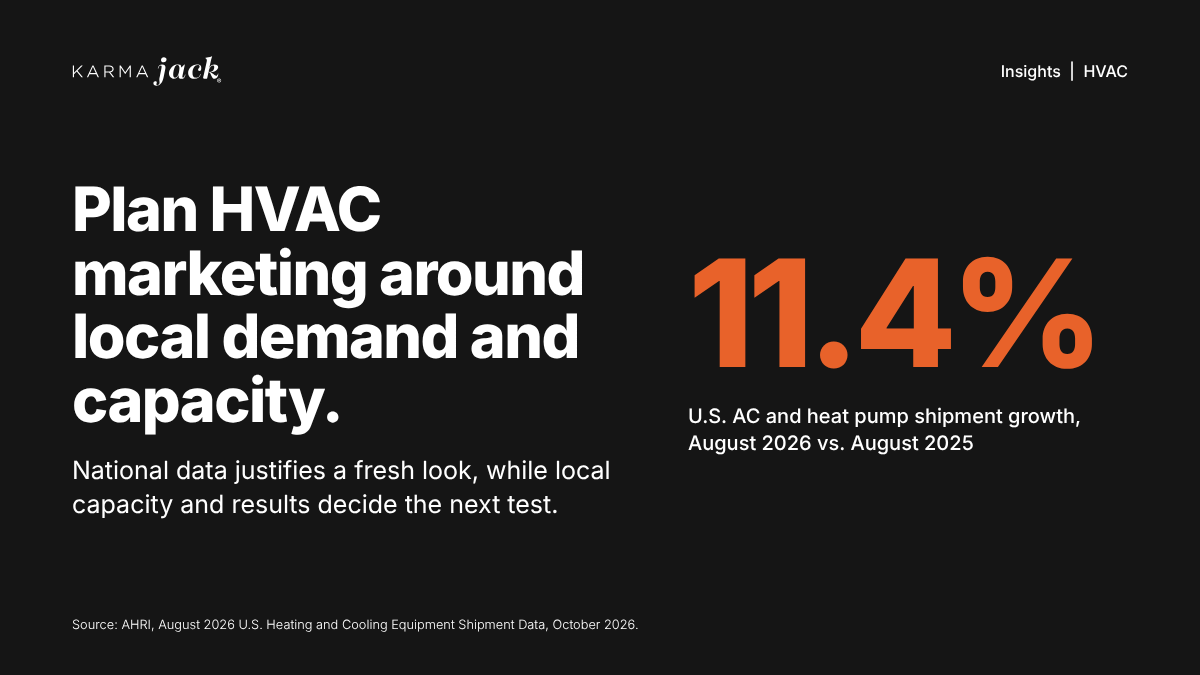
Equipment shipments recovered against 2025. AHRI reported 756,739 combined U.S. central air conditioner and air-source heat pump shipments in August 2026, up 11.4% from August 2025. January through August shipments rose 6.2% to 6,390,257. These are national shipment totals, not completed installations or a measure of any contractor’s sales. [1]
Heat remained a useful planning signal. NOAA reported that September 2026 was the warmest September in the contiguous United States in its record beginning in 1895. The national average was 69.4 degrees Fahrenheit. That describes observed weather, not the number of households ready to replace a system. [2]
Household income needs a careful reading. The Census Bureau reported U.S. real median household income of $87,460 in 2025, up 2.6% from 2024. This national, inflation-adjusted estimate does not establish local homeowners’ cash reserves, credit access or willingness to accept an HVAC quote. [3]
The practical conclusion is modest: current national conditions justify a fresh local review. They do not justify a state ranking, a revenue forecast or a single explanation for lost sales.
Know what each signal measures
Weather describes heating and cooling load
Cooling degree days add the amount by which daily mean temperature exceeds a base of 65 degrees Fahrenheit. Heating degree days use the amount below that base. NOAA explains that population-weighted measures account for where people live, rather than treating every part of a region equally. [4]
For a local brief, compare the same months, geography, base temperature and weighting method. Label observed conditions separately from forecasts. More cooling degree days can support a hypothesis about cooling workload; they do not reveal equipment age, repair-versus-replacement decisions or purchase intent.
What does a Google Trends score of 100 mean?
Keyword Planner reports historical average monthly searches for a keyword and close variants using selected dates, locations and network settings. Its volumes are rounded. Historical statistics and traffic forecasts are different outputs, and advertiser competition is not a measure of organic ranking difficulty. [5]
Google Trends uses a sample of searches and expresses relative interest on a 0 to 100 scale. A value of 100 is not a search count. Equal scores in two places do not imply equal search volumes, and a zero can reflect low volume. Use Trends to explore timing and relative interest, not to calculate local leads. [6]
Household data describes a population
Census ACS estimates can add local household context. Compare like products: one-year with one-year, or non-overlapping five-year periods. Read the margins of error before claiming that places or periods differ. Five-year estimates cover 60 months and trade recency for broader geographic coverage and precision. [7, 8]
Keep income data at the population level. A median is not an individual customer’s budget, and a higher-income market is not automatically a better market for a premium system.
Build a local demand brief
Use the same research structure in Texas, Arkansas, Florida, Georgia or any other service area. Let comparable local evidence determine priorities rather than assigning the same national keyword list a different state rank.
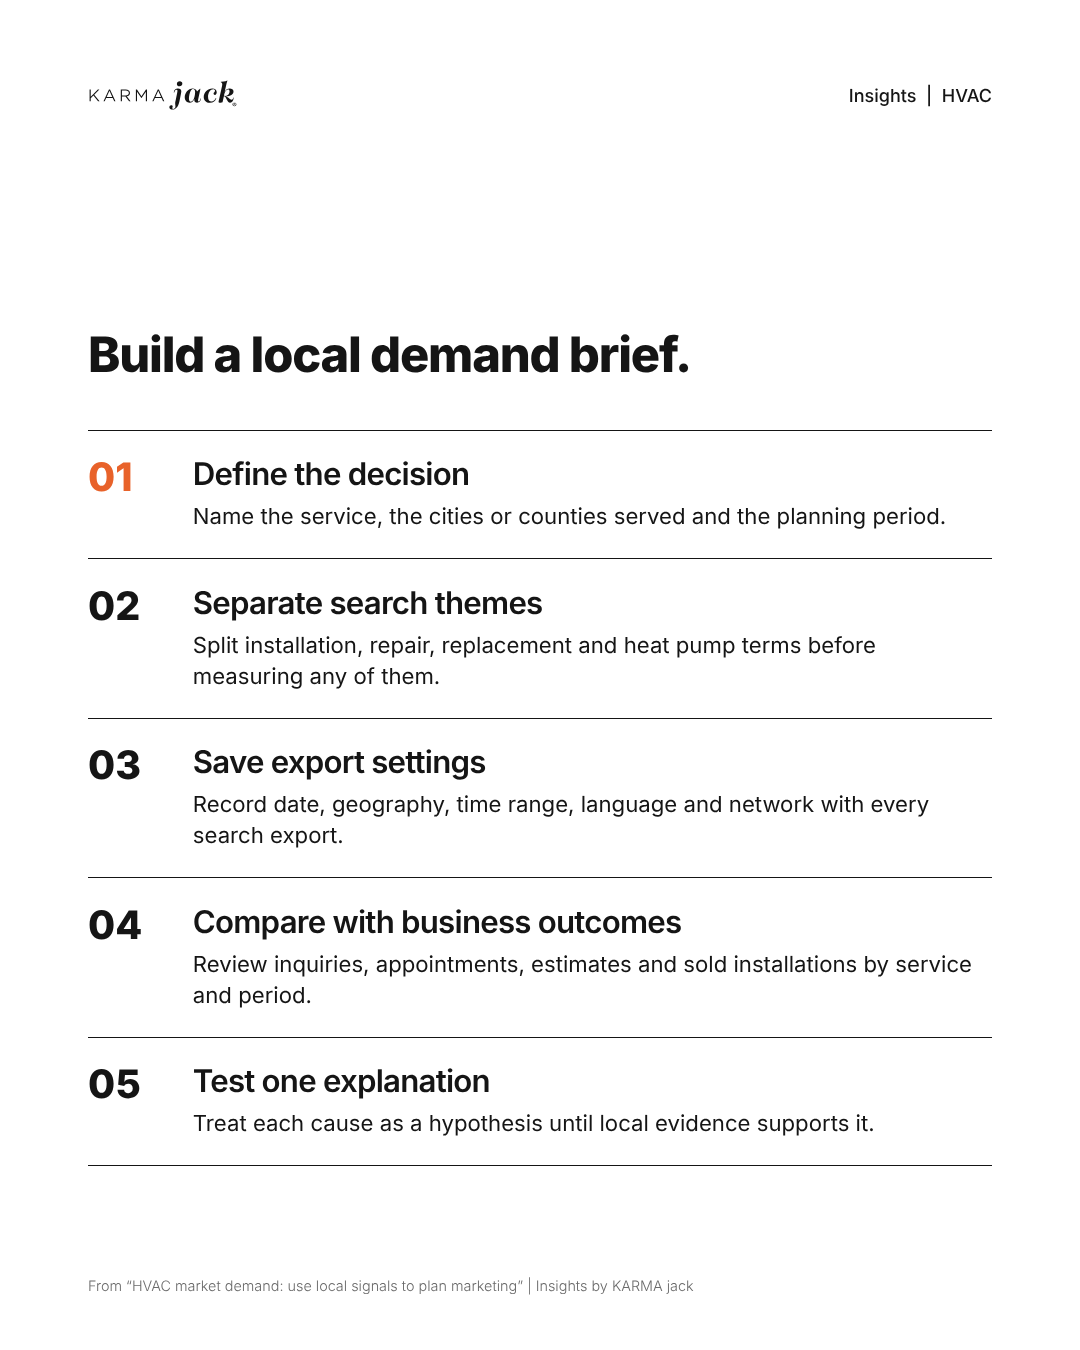
- Define the decision and service area. Specify whether the question is about replacement, repair, new construction or commercial work. Record the cities or counties actually served and the period being planned. Keep service areas consistent across the evidence wherever possible.
- Separate search themes before measuring them. Start with installation, replacement, repair, heat pump, furnace and contractor-selection terms. These are research categories, not ranked opportunities. A broad query such as “HVAC near me” can include several needs; do not count every search as an installation prospect.
- Save the settings with the search export. Record the export date, geography, time range, language and network. Keep monthly history rather than only an annual average. Label any unavailable values as unavailable. A U.S. estimate must stay labeled U.S.; it cannot become a state estimate through reordering. [5]
- Compare local activity with business outcomes. Review qualified inquiries, booked appointments, completed estimates and sold installations by service and period. For estimate-to-sale rate, divide sold installations from a defined estimate cohort by completed estimates in that same cohort. State the follow-up window and keep still-open estimates visible. Check tracking changes, staffing and appointment capacity before attributing a sales change to demand.
- Test one explanation at a time. If inquiries hold steady but estimate acceptance falls, review quote amounts, customer feedback and timing before blaming affordability. If inquiries fall, check visibility, targeting and call handling as well as search and weather patterns. Treat each explanation as a hypothesis until local evidence supports it.
Estimate-to-sale rate = sold installations from a defined estimate cohort ÷ completed estimates in that same cohort. State the follow-up window and keep open estimates visible.
Turn findings into a small test
Choose one service, location and customer question. Name the page, message or appointment step to improve, then record the baseline period, primary outcome, budget and review date. Keep other changes visible, including capacity, weather and promotions. At review, decide whether to continue, revise or stop the test. An inconclusive result is useful when the sample is too small or the comparison changed.
Connect the research to execution
KARMA jack‘s HVAC marketing work connects search, websites and paid campaigns. Bring a defined service area, available capacity, the relevant page and a consistent inquiry-to-sale record to the planning conversation. That gives the team a concrete decision to work on before recommending more traffic.
HVAC market demand FAQs
Can national equipment shipments predict a contractor’s sales?
No. Shipments provide national market context, not completed installations or local purchase intent. Compare local service demand with qualified inquiries, capacity, estimates and sold work before changing the plan.
Does a Google Trends score of 100 mean 100 searches?
No. It is a relative-interest score from a sample of searches. Equal scores across places do not imply equal volumes, and a zero may reflect low volume. Use it to explore timing, not calculate leads.
What should be saved with a local HVAC demand brief?
Record the service, real service area, planning period and research settings. Keep search themes separate, compare with business outcomes and document the baseline, owner and review date for any proposed test.
Sources and scope
Evidence originally checked October 27, 2026; the AHRI shipment, NOAA September weather and Census income figures were rechecked November 12, 2026. Dates below distinguish the observation period from the release date. Source titles are linked to the original public material.
[1] Air-Conditioning, Heating, and Refrigeration Institute. August 2026 U.S. Heating and Cooling Equipment Shipment Data. Released October 9, 2026; August and January through August data, pages 3 to 5. A shipment is a transfer of ownership; public state-level figures are not provided.
[2] NOAA National Centers for Environmental Information. Monitoring the U.S. Temperature and Precipitation in September 2026. Published October 8, 2026; September observations. National temperature context is not a local sales forecast.
[3] U.S. Census Bureau, Zach Scherer. Median Household Income in 2025 Surpassed Previous Highs Before and After the COVID-19 Pandemic. Published September 15, 2026; 2025 income from CPS ASEC. National real-income estimates, not homeowner liquidity.
[4] NOAA Climate Prediction Center. Degree Day Introduction. Undated methodology page; accessed October 27, 2026. Defines heating and cooling degree days and explains population weighting. Outlooks and observations are different products.
[5] Google Ads Help. About Keyword Planner forecasts. Undated help page; accessed October 27, 2026. Defines historical search metrics, forecasts, settings and rounding. Estimates do not guarantee traffic or sales.
[6] Google Trends Help. FAQ about Google Trends data. Undated help page; accessed October 27, 2026. Explains sampling, normalization and low-volume values. Relative interest is not absolute demand.
[7] U.S. Census Bureau. Comparing ACS Data. Revised January 23, 2026; accessed October 27, 2026. Guidance on comparable survey periods, margins of error and geographic changes.
[8] U.S. Census Bureau. Using 1-Year or 5-Year American Community Survey Data. Revised September 2, 2025; accessed October 27, 2026. Explains period coverage, precision and geographic availability.
Scope: Educational guidance, not a market forecast. No authenticated local Keyword Planner exports, local Trends time series or contractor sales records are presented here. Search examples are unranked research prompts. The workflow recommendations are analysis, not measured findings or promises of performance.